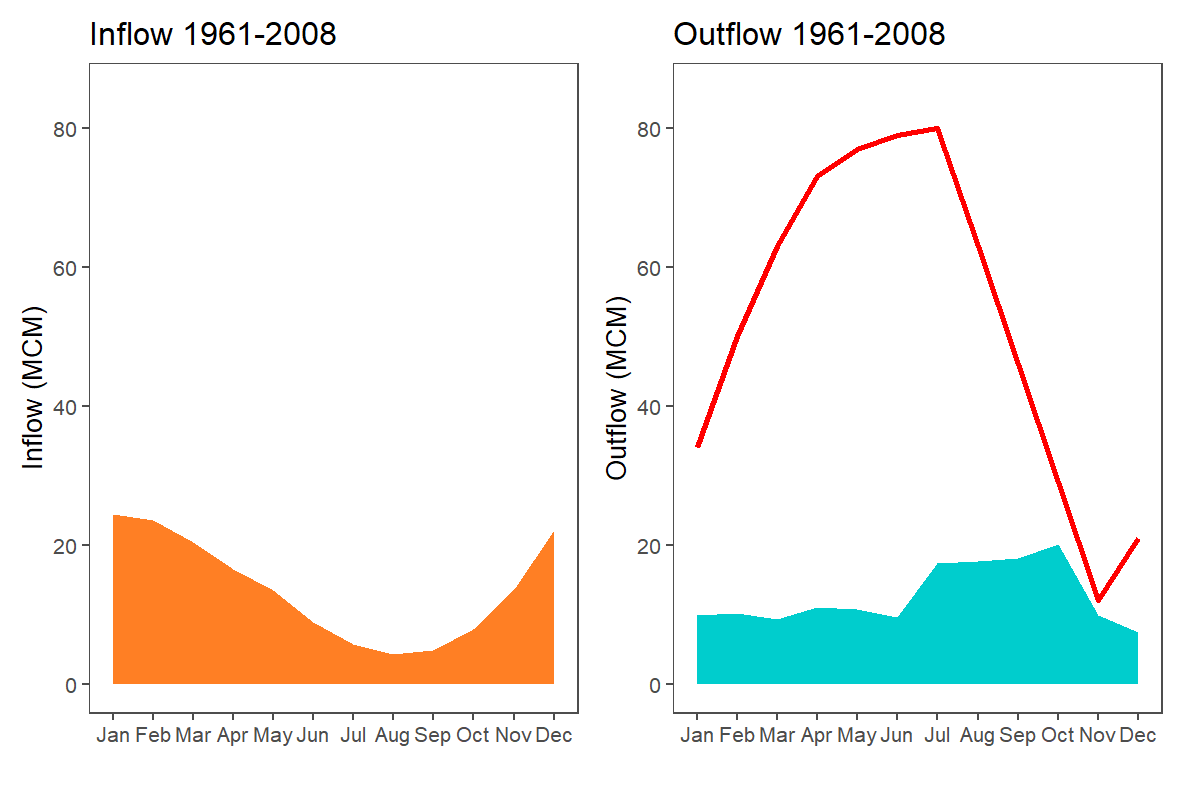
Pannecière inflow and outflow data so different with filling rule curve
library("pacman")
library(hydroTSM)
library(reshape2)
library(patchwork)
pacman::p_load(pacman, dplyr, GGally, ggplot2, ggthemes, ggvis, httr, lubridate, plotly, rio, rmarkdown, shiny, stringr, tidyr)

#--------- For Inflow

inflow<- import("D:/INRAE-montpllier/Data/CHAUM_07_NAT.txt")

# Checking Data from 1961 - 2008
inf.1961.2008 <- as.data.frame(inflow[885:18416, 2]*86400/1000000)  # convert data from m3/s to m3/day
inf.1961.2008[inf.1961.2008<0] <- colMeans(inf.1961.2008)           # Missing value replaced with mean
day <- data.frame(seq(as.Date("1961/1/1"), as.Date("2008/12/31"), "day"))

inf.1961.2008.date <- data.frame(day, inf.1961.2008)    # Adding date with data
z <- zoo(inf.1961.2008.date[, -1], inf.1961.2008.date[, 1])
inf.1961.2008.date.moth<-data.frame(daily2monthly(z, FUN=sum, na.rm = TRUE, dates=1, date.fmt = "%Y-%m-%d", out.type = "data.frame", out.fmt="numeric", verbose = TRUE))  # Convert daily data to monthly data by sum all daily values within a month

month2 <- data.frame(seq(as.Date("1961/1/1"), as.Date("2008/12/31"), "month"))
month <- data.frame(format(as.Date(month2$seq.as.Date..1961.1.1....as.Date..2008.12.31.....month.., format="%Y-%m-%d"),"%m"))
year <- data.frame(format(as.Date(month2$seq.as.Date..1961.1.1....as.Date..2008.12.31.....month.., format="%Y-%m-%d"),"%Y"))

monthy <- data.frame(year, month, inf.1961.2008.date.moth)   # Adding year, month, and data
names(monthy)[1] <- "Year"
names(monthy)[2] <- "Month"
names(monthy)[3] <- "Inflow"
data_L_to_w <- reshape(data=monthy,
                          idvar="Year",
                          v.names = "Inflow",
                          timevar = "Month",
                          direction="wide")            # Reshape data in tabular format

mean <- as.data.frame(colMeans(data_L_to_w[2:13]))     # Mean data
mean$Month<- c(1:12)
mean$Month = factor(mean$Month, labels = c("Jan","Feb","Mar","Apr","May","Jun","Jul","Aug","Sep","Oct","Nov","Dec"))
names(mean)[1] <- "Inflow"

inf <- ggplot(mean, aes(Month, Inflow, group = 1))+
geom_area(aes(y= Inflow), fill = "chocolate1", lwd = 2)+
  ylim(0, 85)+
  labs(title = "Inflow 1961-2008",
       y = "Inflow (MCM)",
       x = "") + theme_few(base_size = 20)


#-----------------------------------------------For Outflow

outflow<- import("D:/INRAE-montpllier/Data/Obs_Panneciere_1949-2008.txt", fill = TRUE)

# Checking Data from 1961 - 2008
out.1961.2008 <- as.data.frame(outflow[4080:21611, 10]*86400/1000000) # Convert from m3/s to m3/day - I don't know which column but assumed to use the column no.10 - flow at turbine.
out.1961.2008[out.1961.2008<0] <- colMeans(out.1961.2008)
day <- data.frame(seq(as.Date("1961/1/1"), as.Date("2008/12/31"), "day"))

out.1961.2008.date <- data.frame(day, out.1961.2008)
out <- zoo(out.1961.2008.date[, -1], out.1961.2008.date[, 1])
out.1961.2008.date.moth<-data.frame(daily2monthly(out, FUN=sum, na.rm = TRUE, dates=1, date.fmt = "%Y-%m-%d", out.type = "data.frame", out.fmt="numeric", verbose = TRUE))

month2 <- data.frame(seq(as.Date("1961/1/1"), as.Date("2008/12/31"), "month"))
month <- data.frame(format(as.Date(month2$seq.as.Date..1961.1.1....as.Date..2008.12.31.....month.., format="%Y-%m-%d"),"%m"))
year <- data.frame(format(as.Date(month2$seq.as.Date..1961.1.1....as.Date..2008.12.31.....month.., format="%Y-%m-%d"),"%Y"))

monthy.out <- data.frame(year, month, out.1961.2008.date.moth)
names(monthy.out)[1] <- "Year"
names(monthy.out)[2] <- "Month"
names(monthy.out)[3] <- "Outflow"
out_L_to_w <- reshape(data=monthy.out,
                       idvar="Year",
                       v.names = "Outflow",
                       timevar = "Month",
                       direction="wide")

mean.out <- as.data.frame(colMeans(out_L_to_w[2:13]))
mean.out$Month<- c(1:12)
mean.out$Month = factor(mean.out$Month, labels = c("Jan","Feb","Mar","Apr","May","Jun","Jul","Aug","Sep","Oct","Nov","Dec"))
names(mean.out)[1] <- "Outflow"
mean.out$rule_curve <- c(34, 50, 63, 73, 77, 79, 80, 63, 46, 29, 12, 21)
out<- ggplot(mean.out, aes(Month, Outflow, group = 1))+
  geom_area(aes(y= Outflow), fill = "cyan3", lwd = 2)+
  geom_line(aes(y= rule_curve), color = "red", lwd = 2)+
  ylim(0, 85)+
  labs(title = "Outflow 1961-2008",
       y = "Outflow (MCM)",
       x = "") + theme_few(base_size = 20)
inf+out
And here is the results: